Chart
Last modified by Cyril Boillat on 12/03/2021
Chart Macro displays graphical charts generated from miscellaneous data sources. Learn more
Pie Chart
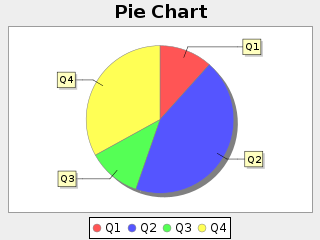
Example 1
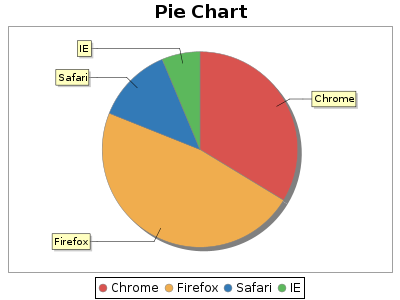
Example 2
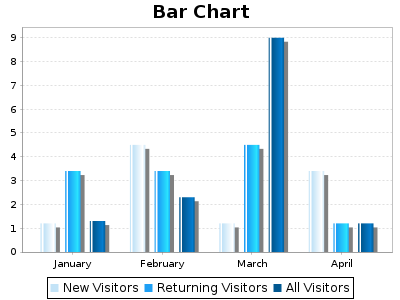
Bar Chart
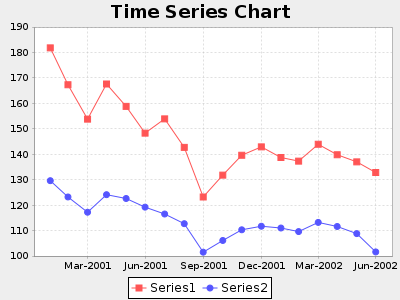
Time Series Chart
{{chart type="xy_line_and_shape" params="range:B2-C19;dataset:timetable_xy;domain_axis_type:date;domain_axis_date_format:MMM-yyyy;date_format:yyyy-MM;time_period:month;range_axis_lower:100;range_axis_upper:190" title="Time Series Chart"}}
|=|=Series1|=Series2
|2001-2|181.8|129.6
|2001-3|167.3|123.2
|2001-4|153.8|117.2
|2001-5|167.6|124.1
|2001-6|158.8|122.6
|2001-7|148.3|119.2
|2001-8|153.9|116.5
|2001-9|142.7|112.7
|2001-10|123.2|101.5
|2001-11|131.8|106.1
|2001-12|139.6|110.3
|2002-1|142.9|111.7
|2002-2|138.7|111.0
|2002-3|137.3|109.6
|2002-4|143.9|113.2
|2002-5|139.8|111.6
|2002-6|137.0|108.8
|2002-7|132.8|101.6
{{/chart}}


